This page documents the details on the LP2011 results from the details of the bkg estimation and final limits setting.
Lepton and Trigger Efficiency
This is based on comparing the EPS dataset and the V5 prompt reco. Because both of the checks described below (comparison of scale factors in new and old dataset and comparison of raw efficiencies in new and old dataset) indicate no significant change in efficiencies we continue to use those scale factors used for the EPS analysis.
- Comparison of scale factors (from Dave)
Electron selections
EPS
> > Measurement  &  $0.00<a<1.48$      & $1.48<a<2.50$  \\
> > $  10<p_T<  15$ & 0.91 $\pm$ 0.02  & 0.85 $\pm$ 0.04  \\ \hline
> > $  15<p_T<  20$ & 0.92 $\pm$ 0.01  & 0.94 $\pm$ 0.02  \\ \hline
> > $  20<p_T<  50$ & 0.97 $\pm$ 0.00  & 0.97 $\pm$ 0.00  \\ \hline
V5

> > Measurement       & $0.00<a<1.48$    & $1.48<a<2.50$  \\
> > $  10<p_T<  15$ & 0.89 $\pm$ 0.04  & 0.80 $\pm$ 0.08  \\ \hline
> > $  15<p_T<  20$ & 0.92 $\pm$ 0.02  & 0.94 $\pm$ 0.04  \\ \hline
> > $  20<p_T<  50$ & 0.97 $\pm$ 0.00  & 0.96 $\pm$ 0.00  \\ \hline
Muon selections
EPS
> > Measurement     & $0.00<a<1.48$    & $1.48<a<2.50$  \\
> > $  10<p_T<  15$ & 0.91 $\pm$ 0.01  & 0.91 $\pm$ 0.02  \\ \hline
> > $  15<p_T<  20$ & 0.94 $\pm$ 0.01  & 0.94 $\pm$ 0.01  \\ \hline
> > $  20<p_T<  50$ & 0.99 $\pm$ 0.00  & 0.99 $\pm$ 0.00  \\ \hline
V5

> > Measurement     & $0.00<a<1.48$    & $1.48<a<2.50$  \\
> > $  10<p_T<  15$ & 0.95 $\pm$ 0.02  & 0.90 $\pm$ 0.03  \\ \hline
> > $  15<p_T<  20$ & 0.94 $\pm$ 0.01  & 0.94 $\pm$ 0.02  \\ \hline
> > $  20<p_T<  50$ & 0.99 $\pm$ 0.00  & 1.00 $\pm$ 0.00  \\ \hline
- Comparison of raw efficiencies (from Kevin)
> Electrons 10<pT<15 Barrel
> > =========================
> >      EPS                PromptReco v5
> > Iso: 0.7760 ± 0.0128
> > ID:  0.5353 ± 0.0116  0.5457 ± 0.0345
> > Sel: 0.4064 ± 0.0250  0.3955 ± 0.0411
> >
> > Electrons 10<pT<15 Endcap
> > =========================
> >      EPS                PromptReco v5
> > Iso: 0.6906 ± 0.0181
> > ID:  0.3173 ± 0.0131  0.2892 ± 0.0306
> > Sel: 0.2079 ± 0.0103  0.1935 ± 0.0265
> >
> > Electrons 15<pT<20 Barrel
> > =========================
> >      EPS                PromptReco v5
> > Iso: 0.8281 ± 0.0065
> > ID:  0.6603 ± 0.0069  0.6549 ± 0.0185
> > Sel: 0.5184 ± 0.0076  0.5443 ± 0.0090
> >
> > Electrons 15<pT<20 Endcap
> > =========================
> >      EPS                PromptReco v5
> > Iso: 0.7674 ± 0.0179
> > ID:  0.4323 ± 0.0089  0.4350 ± 0.0230
> > Sel: 0.3219 ± 0.0101  0.3320 ± 0.0218
> >
> > Electrons pT>20 Barrel
> > =========================
> >      EPS                PromptReco v5
> > Iso: 0.9611 ± 0.0003
> > ID:  0.8722 ± 0.0006  0.8734 ± 0.0048
> > Sel: 0.8288 ± 0.0007  0.8295 ± 0.0019
> >
> > Electrons pT>20 Endcap
> > =========================
> >      EPS                PromptReco v5
> > Iso: 0.9131 ± 0.0007
> > ID:  0.7681 ± 0.0010  0.7554 ± 0.0036
> > Sel: 0.6891 ± 0.0013  0.6808 ± 0.0029
> >
> >
> > Muons 10<pT<15 Barrel
> > =========================
> >      EPS                PromptReco v5
> > Iso: 0.6850 ± 0.0099  0.7304 ± 0.0302
> > ID:  0.9847 ± 0.0031  0.9846 ± 0.0075
> > Sel: 0.6620 ± 0.0108
> >
> > Muons 10<pT<15 Endcap
> > =========================
> >      EPS                PromptReco v5
> > Iso: 0.7377 ± 0.0099  0.7467 ± 0.0279
> > ID:  0.9595 ± 0.0056  0.9558 ± 0.0148
> > Sel: 0.7079 ± 0.0110
> >
> > Muons 15<pT<20 Barrel
> > =========================
> >      EPS                PromptReco v5
> > Iso: 0.7410 ± 0.0055  0.7446 ± 0.0221
> > ID:  0.9885 ± 0.0016  0.9814 ± 0.0057
> > Sel: 0.7306 ± 0.0047  0.7651 ± 0.0188
> >
> > Muons 15<pT<20 Endcap
> > =========================
> >      EPS                PromptReco v5
> > Iso: 0.7499 ± 0.0068  0.7932 ± 0.0147
> > ID:  0.9619 ± 0.0034  0.9572 ± 0.0086
> > Sel: 0.7235 ± 0.0073  0.7543 ± 0.0197
> >
> > Muons pT>20 Barrel
> > =========================
> >      EPS                PromptReco v5
> > Iso: 0.9718 ± 0.0002  0.9730 ± 0.0009
> > ID:  0.9812 ± 0.0002  0.9812 ± 0.0006
> > Sel: 0.9526 ± 0.0002  0.9529 ± 0.0012
> >
> > Muons pT>20 Endcap
> > =========================
> >      EPS                PromptReco v5
> > Iso: 0.9533 ± 0.0006
> > ID:  0.9591 ± 0.0005  0.9566 ± 0.0006
> > Sel: 0.9138 ± 0.0008  0.9193 ± 0.0010
PileUp reweighting Validation
Comparison of the yields at WW selection level for the various backgrounds using as target distribution for PU reweighting either the EPS dataset (1.1/fb) PV multiplicity or the LP dataset one (1.5/fb)
| wjets |
0.000 |
| di-boson |
0.002 |
| Drell-Yan |
0.034 |
| WW |
|
| tt |
0.002 |
| tW |
0.013 |
| Wgamma |
0.007 |
- N_{vtx}:~~~~~~~~~~~~~~~~~~~ EPS+Post EPS~~~~~~~~~~~~~~~~~~~~~~~~~~~~~~~~~~~~~~~EPS~~~~~~~~~~~~~~~~~~~~~~~~~~~~~~~~~~~~~~~Post EPS
Primary Vertex multiplicity distribution of "properly" reweighted (PU multiplicity based) DY->ee and data (in Z mass window). LP json has been used to generate the target PU distribution (from H->gg). Means differ by 0.8 PV

Background Estimations for 1545pb
Top
| jet-bin |
tagged eff. control region |
tagged eff. signal region |
bkg. |
top-tagged events |
estimated top |
MC top |
scale factor |
| 0 |
0.357 +/- 0.020 |
0.525 +/- 0.046 |
26.3 |
106 |
72.1 +/- 17.5 |
48.1 +/- 2.9 |
1.50 +/- 0.24 |
| 1 |
0.681 +/- 0.016 |
0.681 +/- 0.016 |
21.1 |
386 |
170.5 +/- 15.3 |
147.8 +/- 4.4 |
1.15 +/- 0.09 |
-
- 0-jet bin: 1.50 +/- 24%
- 1-jet bin: 1.15 +/- 9%
- 2-jet bin: 1.00 +/- 50%
WW
cvs co -rLP2011_v1 -d HWWScripts UserCode/GCerati/HWWScripts
cd HWWScripts
cvs co -d Smurf/Core UserCode/Smurf/Core
#For MIT smurfs, please open common.C and change the paths adding /data before /smurf.
root -b
.L wwBkg.C++
makeWWTable(1.545)
| m_H |   0-j meas    |   0-j exp     |      SF       |   1-j meas    |   1-j exp     |      SF       |
| 115 | 46.7 +/-  5.3 | 43.7 +/-  0.7 | 1.07 +/- 0.12 | 10.9 +/-  2.9 |  9.9 +/-  0.3 | 1.11 +/- 0.29 |
| 120 | 61.0 +/-  6.9 | 57.2 +/-  0.8 | 1.07 +/- 0.12 | 14.4 +/-  3.8 | 13.0 +/-  0.4 | 1.11 +/- 0.29 |
| 130 | 70.5 +/-  8.0 | 65.8 +/-  0.8 | 1.07 +/- 0.12 | 16.7 +/-  4.4 | 15.0 +/-  0.4 | 1.12 +/- 0.29 |
| 140 | 64.1 +/-  7.2 | 60.9 +/-  0.8 | 1.05 +/- 0.12 | 15.1 +/-  3.9 | 13.6 +/-  0.4 | 1.11 +/- 0.29 |
| 150 | 41.3 +/-  5.0 | 42.0 +/-  0.6 | 0.98 +/- 0.12 | 13.3 +/-  3.6 | 12.2 +/-  0.3 | 1.09 +/- 0.30 |
| 160 | 28.8 +/-  3.5 | 29.2 +/-  0.5 | 0.99 +/- 0.12 | 11.4 +/-  3.1 | 10.4 +/-  0.3 | 1.09 +/- 0.30 |
| 170 | 22.7 +/-  2.8 | 23.0 +/-  0.5 | 0.98 +/- 0.12 |  9.5 +/-  2.6 |  8.7 +/-  0.3 | 1.10 +/- 0.30 |
| 180 | 26.0 +/-  3.2 | 26.5 +/-  0.5 | 0.98 +/- 0.12 | 11.5 +/-  3.1 | 10.3 +/-  0.3 | 1.12 +/- 0.30 |
| 190 | 39.5 +/-  4.7 | 39.9 +/-  0.6 | 0.99 +/- 0.12 | 16.7 +/-  4.4 | 14.9 +/-  0.4 | 1.12 +/- 0.30 |
| 200 | 40.6 +/-  4.9 | 41.5 +/-  0.6 | 0.98 +/- 0.12 | 18.7 +/-  4.9 | 16.5 +/-  0.4 | 1.14 +/- 0.30 |
| m_H |    0-j meas    |    0-j exp     |      SF       |    1-j meas    |    1-j exp     |      SF       |
| 115 | 274.9 +/- 31.1 | 257.8 +/-  1.6 | 1.07 +/- 0.12 |  84.9 +/- 22.3 |  76.8 +/-  0.9 | 1.11 +/- 0.29 |
| 120 | 274.9 +/- 31.1 | 257.8 +/-  1.6 | 1.07 +/- 0.12 |  84.9 +/- 22.3 |  76.8 +/-  0.9 | 1.11 +/- 0.29 |
| 130 | 317.4 +/- 35.9 | 297.6 +/-  1.7 | 1.07 +/- 0.12 |  98.9 +/- 26.0 |  89.4 +/-  0.9 | 1.11 +/- 0.29 |
| 140 | 344.9 +/- 39.0 | 323.4 +/-  1.8 | 1.07 +/- 0.12 | 107.5 +/- 28.3 |  97.3 +/-  1.0 | 1.11 +/- 0.29 |
| 150 | 368.5 +/- 41.7 | 345.5 +/-  1.8 | 1.07 +/- 0.12 | 114.6 +/- 30.1 | 103.6 +/-  1.0 | 1.11 +/- 0.29 |
| 160 | 368.5 +/- 41.7 | 345.5 +/-  1.8 | 1.07 +/- 0.12 | 114.6 +/- 30.1 | 103.6 +/-  1.0 | 1.11 +/- 0.29 |
| 170 | 368.5 +/- 41.7 | 345.5 +/-  1.8 | 1.07 +/- 0.12 | 114.6 +/- 30.1 | 103.6 +/-  1.0 | 1.11 +/- 0.29 |
| 180 | 392.5 +/- 44.4 | 368.0 +/-  1.9 | 1.07 +/- 0.12 | 122.3 +/- 32.2 | 110.6 +/-  1.0 | 1.11 +/- 0.29 |
| 190 | 417.6 +/- 47.2 | 391.6 +/-  2.0 | 1.07 +/- 0.12 | 131.0 +/- 34.4 | 118.5 +/-  1.1 | 1.11 +/- 0.29 |
| 200 | 438.3 +/- 49.5 | 410.9 +/-  2.0 | 1.07 +/- 0.12 | 137.5 +/- 36.2 | 124.3 +/-  1.1 | 1.11 +/- 0.29 |
WJets
| jet-bin |
mm |
me |
em |
ee |
ll |
| 0 |
12.76 +/- 2.24 |
43.67 +/- 2.72 |
66.67 +/- 4.22 |
15.34 +/- 1.47 |
138.46 +/- 5.69 |
| 1 |
6.70 +/- 1.86 |
16.45 +/- 1.87 |
28.18 +/- 2.86 |
4.91 +/- 0.93 |
56.27 +/- 4.00 |
| 2 |
2.04 +/- 1.26 |
2.85 +/- 0.61 |
13.39 +/- 1.90 |
1.42 +/- 0.55 |
22.62 +/- 2.66 |
- SS Closure (0-jet, WW selection):
- observed in data: 92
- predicted fake contribution: 68.4+/-3.8+15.6-10.6
- MC based nonfake estimate: 28.0+/-1.9
- Wgamma: 13.34+/-1.80
- WZ: 12.87+/-0.42
- WW: 1.83+/-0.14
Drell-Yan
post-EPS data validations
We cross-check the background estimations between the post-EPS and EPS data set. It needs to be done in both WW and Higgs level.
Integrated luminosity:
- EPS: 1.143/fb
- Post EPS: 0.402/fb
- LP: 1.545/fb
Post EPS period starts with run 170826 in the good run list. Expected yield ratio for EPS vs post-EPS is 2.8
WW
| m_H |   0-j meas    |   0-j exp     |      SF       |   1-j meas    |   1-j exp     |      SF       |
| 115 | 34.1 +/-  4.4 | 32.4 +/-  0.5 | 1.05 +/- 0.14 |  8.3 +/-  2.4 |  7.3 +/-  0.2 | 1.14 +/- 0.33 |
| 120 | 44.6 +/-  5.8 | 42.3 +/-  0.6 | 1.05 +/- 0.14 | 11.0 +/-  3.2 |  9.6 +/-  0.3 | 1.14 +/- 0.33 |
| 130 | 51.5 +/-  6.6 | 48.7 +/-  0.6 | 1.06 +/- 0.14 | 12.8 +/-  3.7 | 11.1 +/-  0.3 | 1.16 +/- 0.33 |
| 140 | 47.0 +/-  6.0 | 45.1 +/-  0.6 | 1.04 +/- 0.13 | 11.4 +/-  3.3 | 10.1 +/-  0.3 | 1.13 +/- 0.33 |
| 150 | 30.5 +/-  4.2 | 31.1 +/-  0.5 | 0.98 +/- 0.13 | 10.3 +/-  3.0 |  9.0 +/-  0.3 | 1.14 +/- 0.34 |
| 160 | 21.2 +/-  2.9 | 21.6 +/-  0.4 | 0.98 +/- 0.14 |  8.8 +/-  2.6 |  7.7 +/-  0.2 | 1.14 +/- 0.34 |
| 170 | 16.8 +/-  2.3 | 17.0 +/-  0.3 | 0.99 +/- 0.14 |  7.4 +/-  2.2 |  6.4 +/-  0.2 | 1.15 +/- 0.34 |
| 180 | 19.2 +/-  2.6 | 19.6 +/-  0.4 | 0.98 +/- 0.14 |  9.0 +/-  2.6 |  7.6 +/-  0.2 | 1.18 +/- 0.34 |
| 190 | 29.0 +/-  4.0 | 29.6 +/-  0.5 | 0.98 +/- 0.14 | 13.0 +/-  3.7 | 11.0 +/-  0.3 | 1.18 +/- 0.34 |
| 200 | 29.6 +/-  4.1 | 30.7 +/-  0.5 | 0.96 +/- 0.14 | 14.6 +/-  4.2 | 12.2 +/-  0.3 | 1.19 +/- 0.34 |
- Post-EPS period, cut-based
  | m_H |   0-j meas    |   0-j exp     |      SF       |   1-j meas    |   1-j exp     |      SF       |
| 115 | 12.4 +/-  2.2 | 11.4 +/-  0.2 | 1.09 +/- 0.20 |  2.6 +/-  1.3 |  2.6 +/-  0.1 | 1.00 +/- 0.51 |
| 120 | 16.2 +/-  2.9 | 14.9 +/-  0.2 | 1.09 +/- 0.20 |  3.4 +/-  1.7 |  3.4 +/-  0.1 | 1.00 +/- 0.51 |
| 130 | 18.8 +/-  3.3 | 17.1 +/-  0.2 | 1.10 +/- 0.20 |  3.9 +/-  2.0 |  3.9 +/-  0.1 | 1.00 +/- 0.51 |
| 140 | 17.0 +/-  3.1 | 15.9 +/-  0.2 | 1.07 +/- 0.19 |  3.7 +/-  1.8 |  3.5 +/-  0.1 | 1.03 +/- 0.51 |
| 150 | 10.7 +/-  2.1 | 10.9 +/-  0.2 | 0.98 +/- 0.20 |  3.0 +/-  1.7 |  3.2 +/-  0.1 | 0.95 +/- 0.52 |
| 160 |  7.5 +/-  1.5 |  7.6 +/-  0.1 | 0.98 +/- 0.20 |  2.6 +/-  1.4 |  2.7 +/-  0.1 | 0.95 +/- 0.52 |
| 170 |  5.8 +/-  1.2 |  6.0 +/-  0.1 | 0.97 +/- 0.20 |  2.2 +/-  1.2 |  2.3 +/-  0.1 | 0.96 +/- 0.53 |
| 180 |  6.7 +/-  1.4 |  6.9 +/-  0.1 | 0.98 +/- 0.20 |  2.6 +/-  1.4 |  2.7 +/-  0.1 | 0.96 +/- 0.53 |
| 190 | 10.4 +/-  2.1 | 10.4 +/-  0.2 | 1.00 +/- 0.20 |  3.8 +/-  2.1 |  3.9 +/-  0.1 | 0.97 +/- 0.53 |
| 200 | 11.0 +/-  2.2 | 10.8 +/-  0.2 | 1.02 +/- 0.20 |  4.2 +/-  2.3 |  4.3 +/-  0.1 | 0.98 +/- 0.54 |
| m_H |   0-j meas    |   0-j exp     |      SF       |   1-j meas    |   1-j exp     |      SF       |
| 115 | 201.2 +/- 25.9 | 190.7 +/-  1.2 | 1.05 +/- 0.14 | 64.9 +/- 18.7 | 56.8 +/-  0.6 | 1.14 +/- 0.33 |
| 120 | 201.2 +/- 25.9 | 190.7 +/-  1.2 | 1.05 +/- 0.14 | 64.9 +/- 18.7 | 56.8 +/-  0.6 | 1.14 +/- 0.33 |
| 130 | 232.2 +/- 29.9 | 220.2 +/-  1.3 | 1.05 +/- 0.14 | 75.6 +/- 21.8 | 66.1 +/-  0.7 | 1.14 +/- 0.33 |
| 140 | 252.4 +/- 32.4 | 239.2 +/-  1.3 | 1.05 +/- 0.14 | 82.2 +/- 23.7 | 71.9 +/-  0.7 | 1.14 +/- 0.33 |
| 150 | 269.6 +/- 34.7 | 255.6 +/-  1.4 | 1.05 +/- 0.14 | 87.6 +/- 25.2 | 76.7 +/-  0.7 | 1.14 +/- 0.33 |
| 160 | 269.6 +/- 34.7 | 255.6 +/-  1.4 | 1.05 +/- 0.14 | 87.6 +/- 25.2 | 76.7 +/-  0.7 | 1.14 +/- 0.33 |
| 170 | 269.6 +/- 34.7 | 255.6 +/-  1.4 | 1.05 +/- 0.14 | 87.6 +/- 25.2 | 76.7 +/-  0.7 | 1.14 +/- 0.33 |
| 180 | 287.2 +/- 36.9 | 272.2 +/-  1.4 | 1.05 +/- 0.14 | 93.5 +/- 26.9 | 81.8 +/-  0.8 | 1.14 +/- 0.33 |
| 190 | 305.6 +/- 39.3 | 289.7 +/-  1.5 | 1.05 +/- 0.14 | 100.1 +/- 28.8 | 87.6 +/-  0.8 | 1.14 +/- 0.33 |
| 200 | 320.7 +/- 41.2 | 304.0 +/-  1.5 | 1.05 +/- 0.14 | 105.1 +/- 30.3 | 92.0 +/-  0.8 | 1.14 +/- 0.33 |
- Post-EPS period, MVA-based
| m_H |   0-j meas    |   0-j exp     |      SF       |   1-j meas    |   1-j exp     |      SF       |
| 115 | 73.1 +/- 13.1 | 67.1 +/-  0.4 | 1.09 +/- 0.20 | 20.0 +/- 10.2 | 20.0 +/-  0.2 | 1.00 +/- 0.51 |
| 120 | 73.1 +/- 13.1 | 67.1 +/-  0.4 | 1.09 +/- 0.20 | 20.0 +/- 10.2 | 20.0 +/-  0.2 | 1.00 +/- 0.51 |
| 130 | 84.3 +/- 15.1 | 77.4 +/-  0.4 | 1.09 +/- 0.20 | 23.3 +/- 11.9 | 23.3 +/-  0.2 | 1.00 +/- 0.51 |
| 140 | 91.7 +/- 16.5 | 84.1 +/-  0.5 | 1.09 +/- 0.20 | 25.3 +/- 12.9 | 25.3 +/-  0.3 | 1.00 +/- 0.51 |
| 150 | 97.9 +/- 17.6 | 89.9 +/-  0.5 | 1.09 +/- 0.20 | 27.0 +/- 13.7 | 27.0 +/-  0.3 | 1.00 +/- 0.51 |
| 160 | 97.9 +/- 17.6 | 89.9 +/-  0.5 | 1.09 +/- 0.20 | 27.0 +/- 13.7 | 27.0 +/-  0.3 | 1.00 +/- 0.51 |
| 170 | 97.9 +/- 17.6 | 89.9 +/-  0.5 | 1.09 +/- 0.20 | 27.0 +/- 13.7 | 27.0 +/-  0.3 | 1.00 +/- 0.51 |
| 180 | 104.3 +/- 18.7 | 95.7 +/-  0.5 | 1.09 +/- 0.20 | 28.8 +/- 14.7 | 28.8 +/-  0.3 | 1.00 +/- 0.51 |
| 190 | 111.0 +/- 19.9 | 101.9 +/-  0.5 | 1.09 +/- 0.20 | 30.9 +/- 15.7 | 30.8 +/-  0.3 | 1.00 +/- 0.51 |
| 200 | 116.5 +/- 20.9 | 106.9 +/-  0.5 | 1.09 +/- 0.20 | 32.4 +/- 16.5 | 32.4 +/-  0.3 | 1.00 +/- 0.51 |
Top
| Period |
scale factor 0-jet bin |
scale factor 1-jet bin |
| EPS |
1.67 +/- 0.25 |
1.20 +/- 0.10 |
| post-EPS |
1.12 +/- 0.40 |
1.02 +/- 0.18 |
| EPS+post-EPS |
1.50 +/- 0.24 |
1.15 +/- 0.09 |
*** EPS ***
--------------------------------------------------------------------------------
|                                   Sample | 0-jet           | 1-jet           |
--------------------------------------------------------------------------------
|       Estimated top events in simulation |  35.7 +/- 2.3   | 109.5 +/- 4.3   |
|                   tagging efficiency (%) |  50.9 +/- 4.0   |  67.3 +/- 1.8   |
|                top-tagged events in data |  82.0 +/- 9.1   | 290.0 +/- 17.0  |
|      background events in control region |  21.9 +/- 21.9  |  19.5 +/- 19.5  |
|      Data-driven top background estimate |  58.1 +/- 24.7  | 131.7 +/- 16.6  |
--------------------------------------------------------------------------------

*** POST-EPS ***
--------------------------------------------------------------------------------
|                                   Sample | 0-jet           | 1-jet           |
--------------------------------------------------------------------------------
|       Estimated top events in simulation |  12.5 +/- 0.8   |  38.3 +/- 1.5   |
|                   tagging efficiency (%) |  58.0 +/- 5.5   |  69.1 +/- 3.0   |
|                top-tagged events in data |  24.0 +/- 4.9   |  96.0 +/- 9.8   |
|      background events in control region |   5.2 +/- 5.2   |   7.3 +/- 7.3   |
|      Data-driven top background estimate |  13.7 +/- 6.0   |  39.7 +/- 7.9   |
--------------------------------------------------------------------------------

*** EPS+POST-EPS ***
--------------------------------------------------------------------------------
|                                   Sample | 0-jet           | 1-jet           |
--------------------------------------------------------------------------------
|       Estimated top events in simulation |  48.2 +/- 3.1   | 148.1 +/- 5.8   |
|                   tagging efficiency (%) |  52.8 +/- 3.8   |  67.7 +/- 1.6   |
|                top-tagged events in data | 106.0 +/- 10.3  | 386.0 +/- 19.6  |
|      background events in control region |  27.0 +/- 27.0  |  26.9 +/- 26.9  |
|      Data-driven top background estimate |  70.6 +/- 28.0  | 171.1 +/- 20.0  |
--------------------------------------------------------------------------------
WJets
| Period |
mm |
me |
em |
ee |
ll |
| EPS |
11.85 +/- 2.10 |
32.15 +/- 2.38 |
51.40 +/- 3.73 |
12.45 +/- 1.32 |
107.86 +/- 5.08 |
| post-EPS |
0.90 +/- 0.74 |
11.52 +/- 1.29 |
15.27 +/- 1.95 |
2.88 +/- 0.65 |
30.59 +/- 2.55 |
| EPS+post-EPS |
12.76 +/- 2.24 |
43.67 +/- 2.72 |
66.67 +/- 4.22 |
15.34 +/- 1.47 |
138.46 +/- 5.69 |
| Period |
mm |
me |
em |
ee |
ll |
| EPS |
5.35 +/- 1.60 |
10.46 +/- 1.43 |
19.91 +/- 2.45 |
3.40 +/- 0.78 |
39.14 +/- 3.35 |
| post-EPS |
1.35 +/- 0.89 |
5.98 +/- 1.19 |
8.27 +/- 1.44 |
1.50 +/- 0.49 |
17.13 +/- 2.13 |
| EPS+post-EPS |
6.70 +/- 1.86 |
16.45 +/- 1.87 |
28.18 +/- 2.86 |
4.91 +/- 0.93 |
56.27 +/- 4.00 |
| Period |
mm |
me |
em |
ee |
ll |
| EPS |
0.19 +/- 0.86 |
4.81 +/- 1.12 |
9.75 +/- 1.60 |
1.09 +/- 0.48 |
15.85 +/- 2.19 |
| post-EPS |
1.85 +/- 0.88 |
0.94 +/- 0.50 |
3.64 +/- 1.00 |
0.32 +/- 0.25 |
6.76 +/- 1.45 |
| EPS+post-EPS |
2.04 +/- 1.26 |
2.85 +/- 0.61 |
13.39 +/- 1.90 |
1.42 +/- 0.55 |
22.62 +/- 2.66 |
- SS Closure (0-jet, WW selection)
Drell-Yan
- The DY estimations are consistent with the EPS results within the large statistical uncertainties
- WW selection level (0-Jet Bin)
| Sample |
R |
N(in)-raw |
N(in) (OF/VZ subt) |
N(in) data/MC |
N(out)-data |
N(out) MC |
N(out) data/MC |
| EPS |
0.25+/-0.06+/-0.03 |
65/16/21/39 |
20.41+/-12.82 |
3.21+/-2.05 |
5.01+/-3.36+/-0.64 |
1.44+/-0.31 |
3.47+/-2.26 |
| post-EPS |
0.25+/-0.06+/-0.03 |
18/6/7/17 |
5.61+/-7.18 |
2.51+/-3.22 |
1.38+/-1.79+/-0.18 |
0.51+/-0.11 |
2.71+/-3.50 |
| LP |
0.25+/-0.06+/-0.03 |
83/22/28/56 |
26.02+/-15.19 |
3.02+/-1.80 |
6.39+/-4.02+/-0.82 |
2.11+/-0.44 |
3.02+/-1.84 |
- WW selection level (1-Jet Bin)
| Sample |
R |
N(in)-raw |
N(in) (OF/VZ subt) |
N(in) data/MC |
N(out)-data |
N(out) MC |
N(out) data/MC |
| EPS |
0.14+/-0.03+/-0.07 |
53/8/12/32 |
47.52+/-10.46 |
2.69+/-0.62 |
6.80+/-1.94+/-3.10 |
2.53+/-0.43 |
2.69+/-1.37 |
| post-EPS |
0.14+/-0.03+/-0.07 |
24/4/7/13 |
19.72+/-7.01 |
3.17+/-1.15 |
2.82+/-1.13+/-1.29 |
0.89+/-0.15 |
3.17+/-1.84 |
| LP |
0.14+/-0.03+/-0.07 |
77/12/19/45 |
67.24+/-12.67 |
2.81+/-0.56 |
9.62+/-2.52+/-4.38 |
3.42+/-0.58 |
2.81+/-1.40 |
- WW selection level (2-Jet Bin)
| Sample |
R |
N(in)-raw |
N(in) (OF/VZ subt) |
N(in) data/MC |
N(out)-data |
N(out) MC |
N(out) data/MC |
| EPS |
0.15+/-0.02+/-0.06 |
84/5/3/58 |
129.55+/-12.28 |
4.81+/-0.52 |
19.75+/-3.42+/-7.22 |
4.10+/-0.55 |
4.81+/-1.84 |
| post-EPS |
0.15+/-0.02+/-0.06 |
26/1/2/25 |
46.43+/-7.36 |
4.90+/-0.82 |
7.08+/-1.52+/-2.59 |
1.44+/-0.19 |
4.90+/-1.97 |
| LP |
0.15+/-0.02+/-0.06 |
110/6/5/83 |
175.97+/-14.32 |
4.84+/-0.47 |
26.83+/-4.45+/-9.81 |
5.55+/-0.74 |
4.84+/-1.83 |
Kinematic distributions
- From Guillelmo
- DeltaPhi(mu-mu), WW 0-jet bin}:~~~~ EPS+Post EPS~~~~~~~~~~~~~~~~~~~~~~EPS~~~~~~~~~~~~~Post EPS
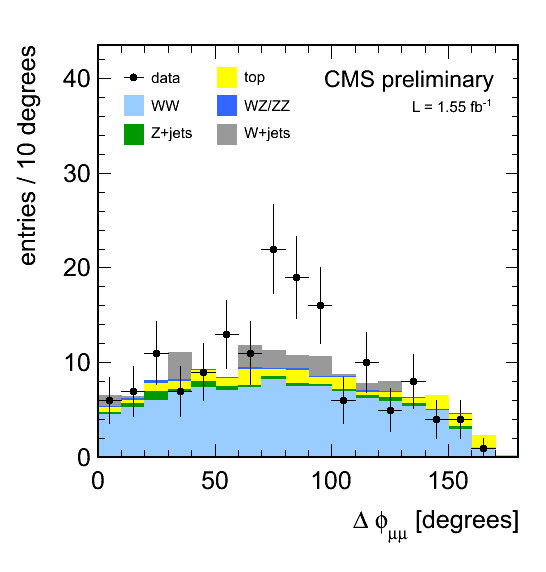  
* Comparison of EPS and post-EPS data (plots scaled to 1/fb, error bars are sum in quadrature of stat uncertainty of EPS and post-EPS data) and comparison of LP dataset with stacked MC: plots-EPS-LP_v2.pdf. | 

